Subsurface Imaging Presentation
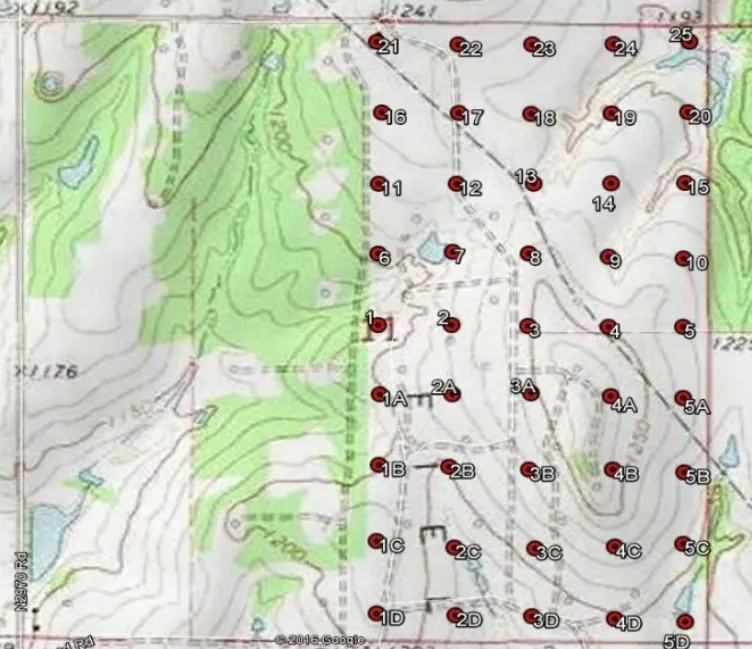
Based on our satellite analysis, we create a data grid
- Each red dot has been mapped to create a data-grid
- Precise GPS lat/long recording is used to log each data location
- Elevation, time of day, and environmental conditions are all recorded for each point
- We then travel to each data point and initiate the data recording process
The technical process involves
1. We perform satellite analysis of the area to be surveyed
2. We create a data point grid system at the client's desired resolution
3. We obtain special permission to enter the area
4. We set up proprietary equipment to gather data – we take the data back to the office for processing – no processing is done on-site.
5. We use proprietary software to analyze the data
6. We then enter the data into a 3D display system for viewing
7. Graphics are printed out, a report is made, and data is analyzed by a geologist for useful features. The next two pages show the concept and data gathering concept
We process the digital data into a 3D matrix
Examples of 3D data from past surveys
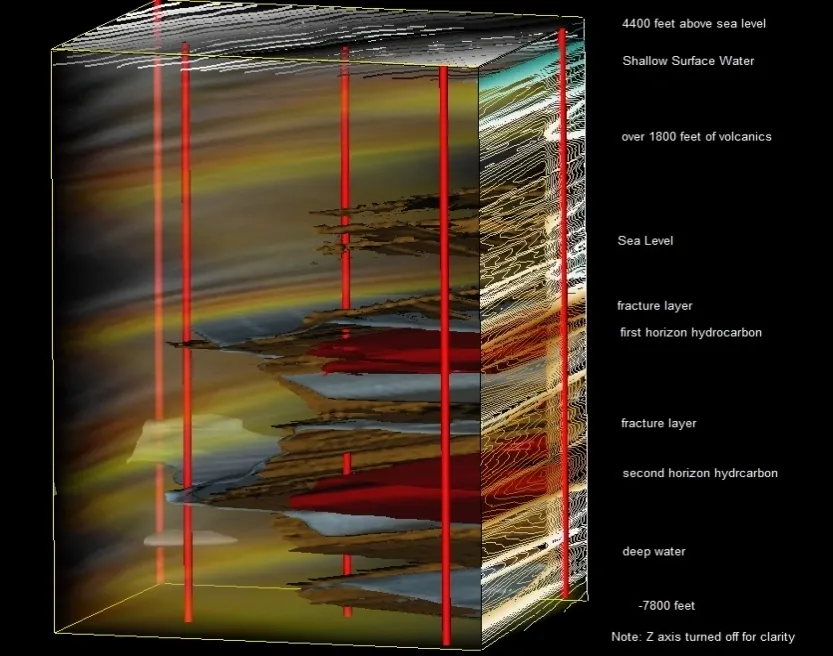
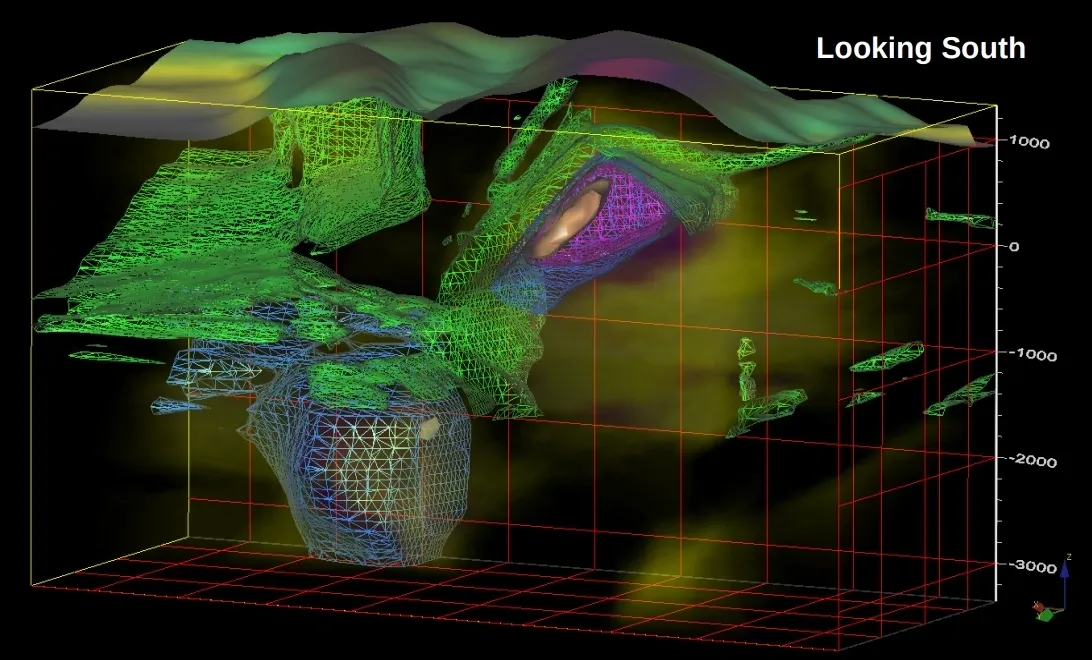
Examples of 3D data from past surveys
- This image shows, from the surface, the volcano into two zones
- This is next to a well which had gone to water and was no longer producing
- It produced thousands of bbls per day and had to be choked down
- The next page shows the zones clearly
Examples of 3D data from past surveys
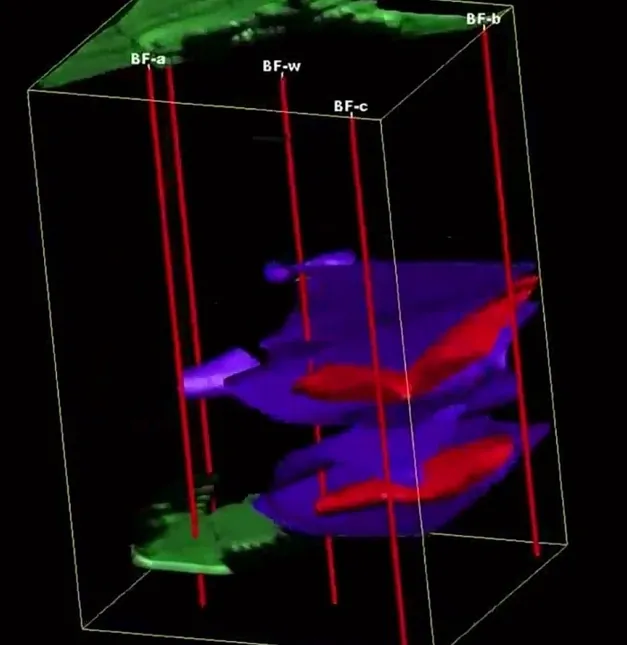
Examples of 3D data from past surveys
- 3D Data from a dry lake bed near a well that has gone to water
- The well location BF-W is shown
- The formation, however, being quite tight, had been emptied of the hydrocarbon (red) and was going to water
- Missed PAY – the remaining formation was not extracted
- Deeper zone was not extracted
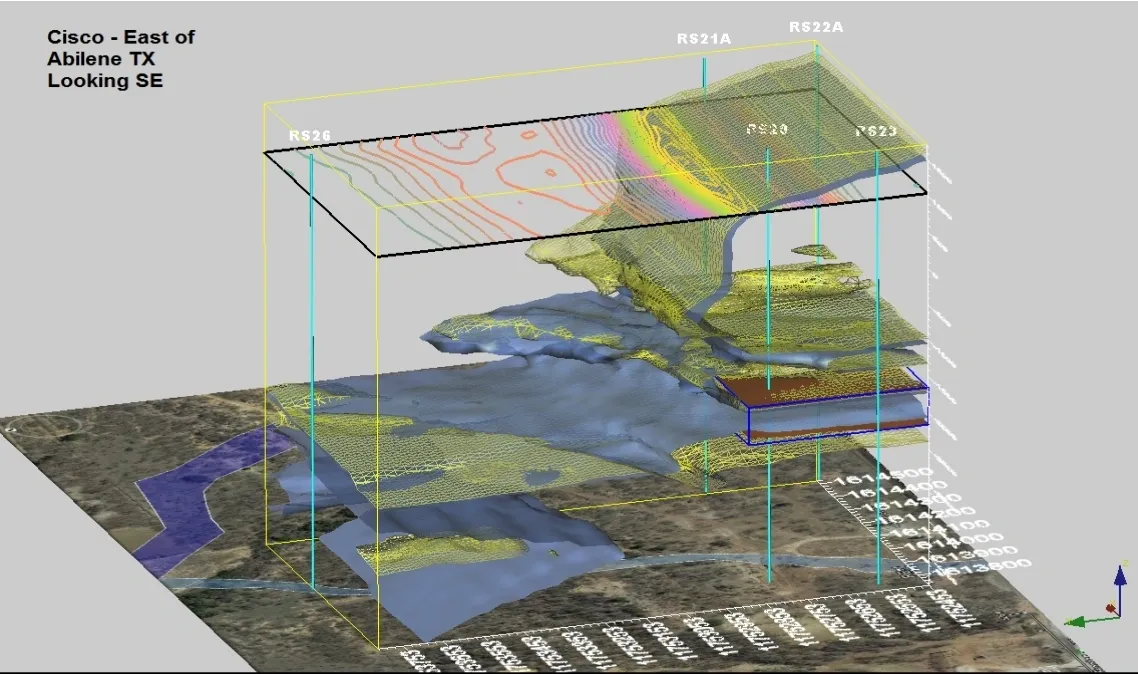
Examples of 3D data from past surveys
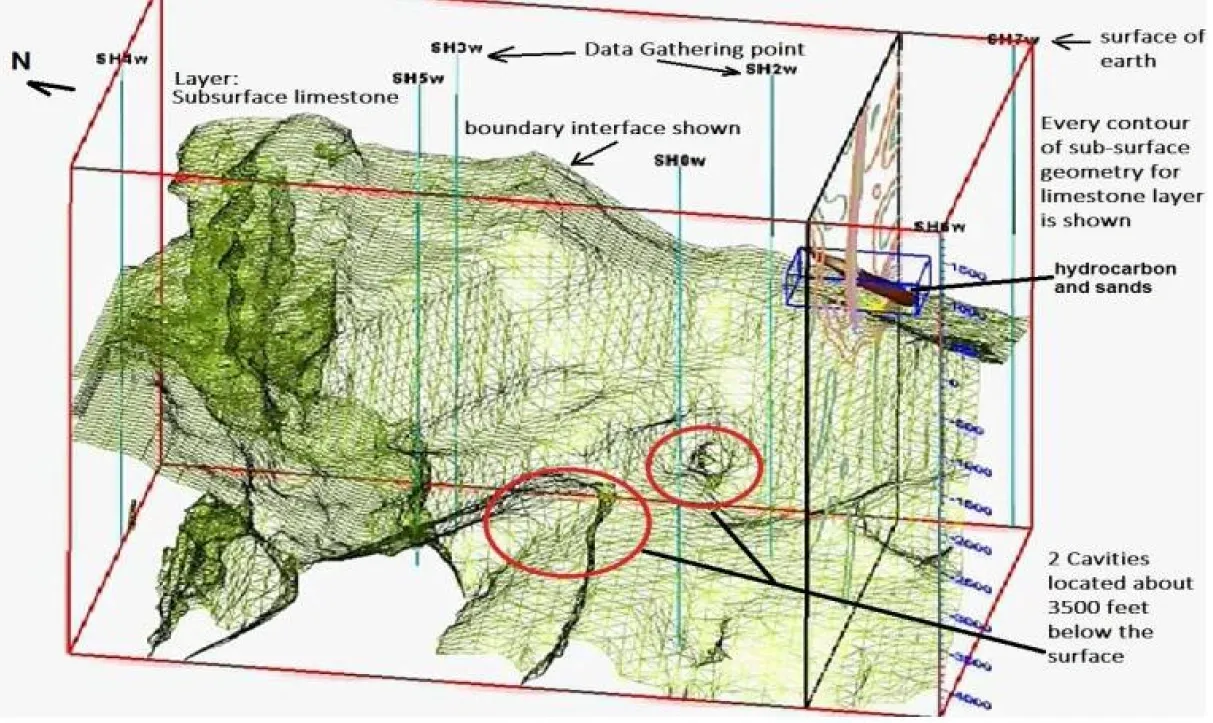
- Producing wells in yellow sands (shallow, ~ 300-foot depth)
- Underground cliff (granite)
- Water and hydrocarbon migration upwards from two deeper source zones into the shallow sands
- ** The shallow production was derived from deep source rocks
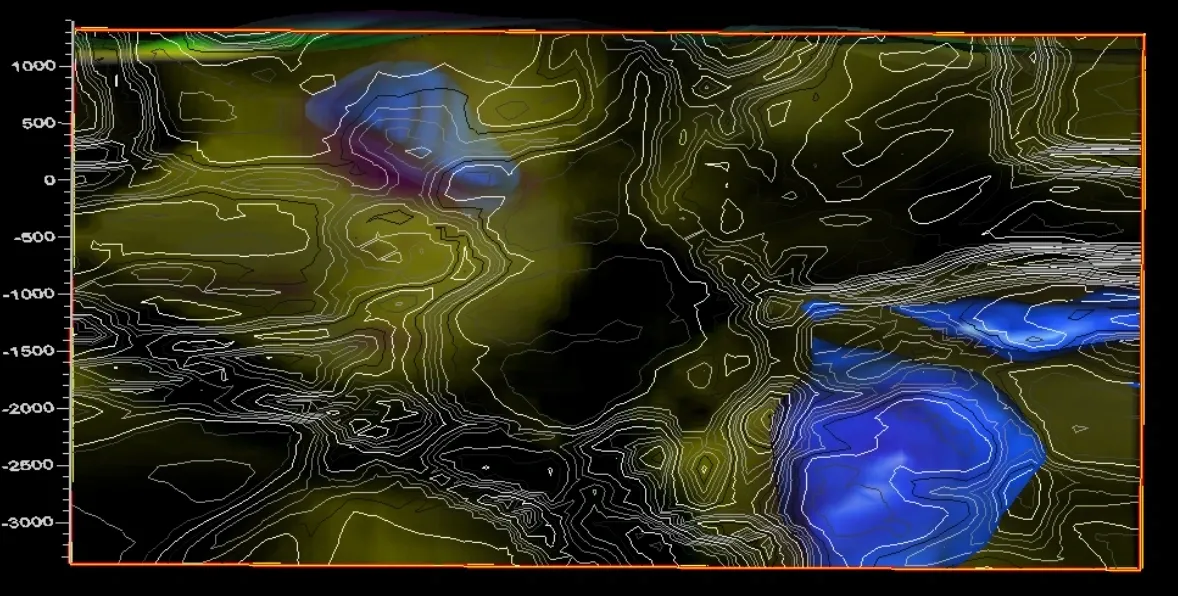
Examples of 3D data from past surveys
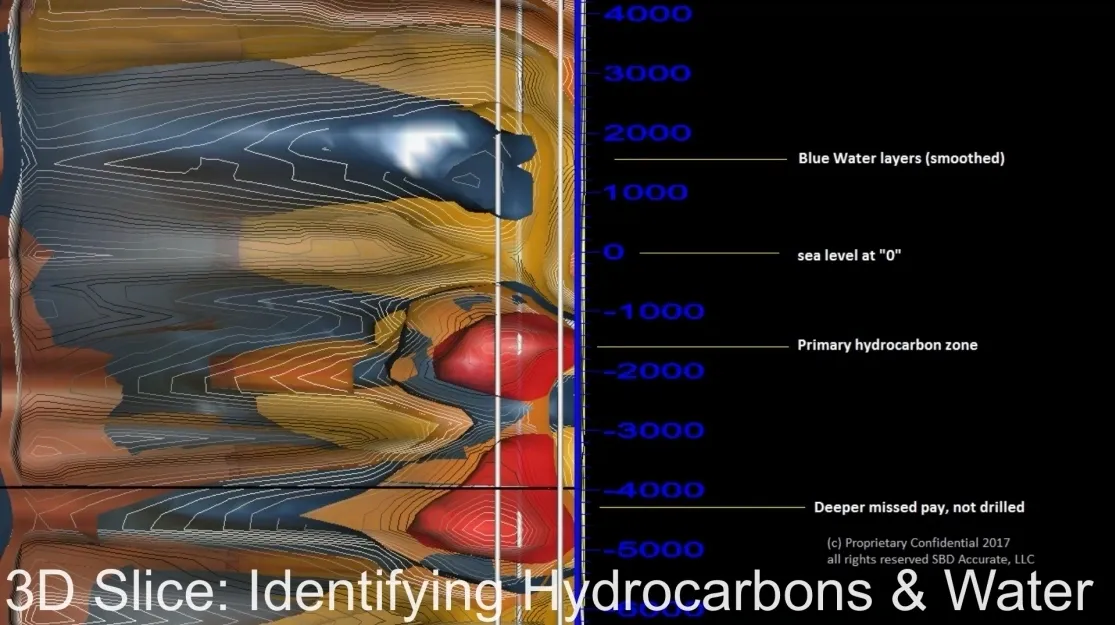
Examples of 3D data from past surveys
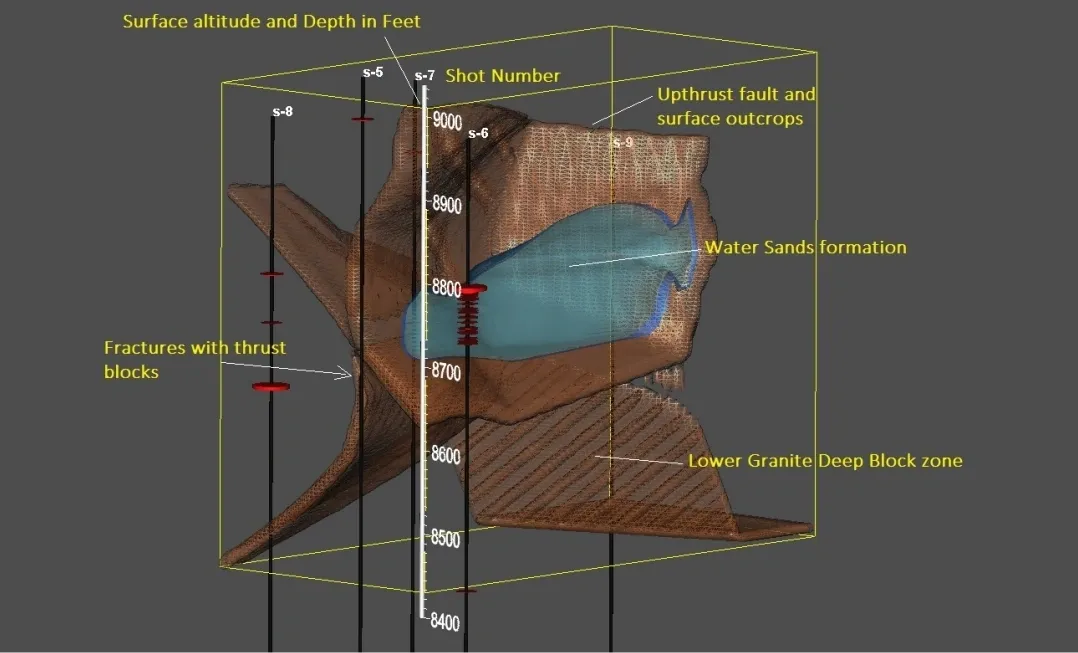
Cross-section view (to depth), looking NORTH – BLUE shallow and deep aquifer
Examples of 3D data from past surveys
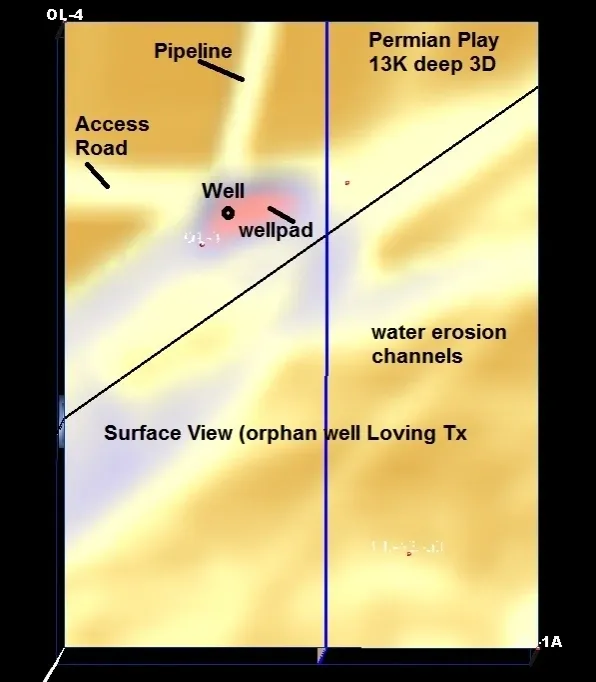
Examples of 3D data from past surveys
- The technology was able to discern surface features such as the PAD, the access road, the pipeline as well and water erosion paths.
- Water was pulling at the surface in the depressed spots, as shown in blue
- This well was an Orphan Well near Loving, Texas, in a Permian Basin play
- Total scan depth to 13 K+ feet below the surface
- (The next page shows formation zones)
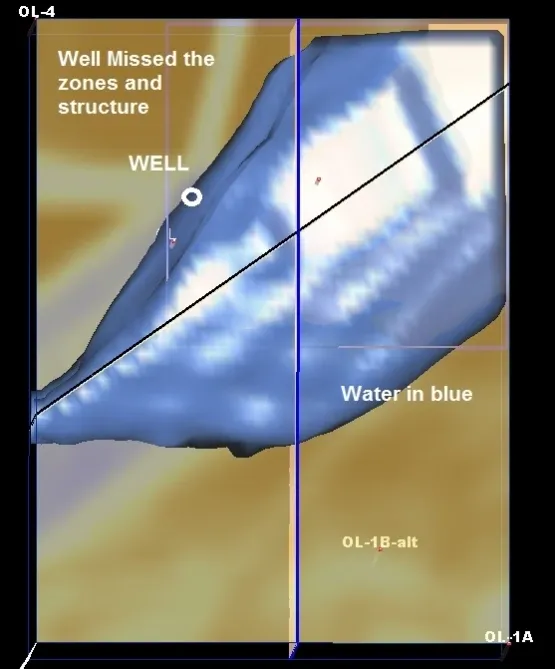
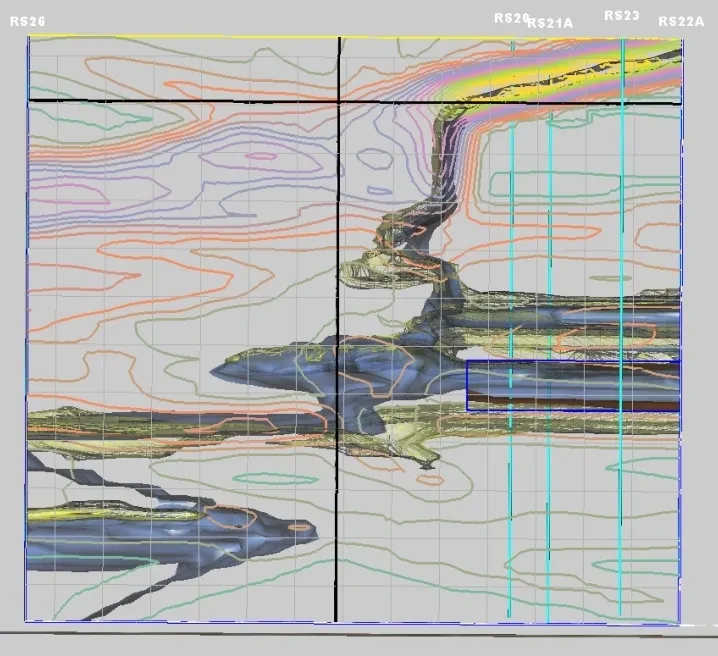
Examples of 3D data from past surveys
- Looking TOP DOWN at the Orphan Well in Loving area (Permian Play)
- The well was drilled NW of the actual formation and missed by 200 feet
- (The next images show top down, but turn OFF the water layer – red shows the hydrocarbon that was missed)